


The Getting Started section is a brief description of the organization and operation of the software from the user's point of view. This section provides a closer look on the different types of users of pSuite software, their roles and responsibilities, access rights and authentication mechanism. Apart from the user’s information, this section also provides the in-depth detail of the features and functionality of the pSuite’s user interface.
The pSuite users are categorized into two major categories on the basis of the accessibility roles assigned to them as follows:
-
Administrators.
-
Users
Access rights and roles
The pSuite allows administrators and accounts managers to provide access rights and assign roles to its users into different modules of the software. A user can access only those modules and its features for which he/ she have been assigned the access rights and relevant roles. (For details see Manage and define Roles)
Modules in pSuite
There are seven different modules available in pSuite for all its users. Users are allocated certain access rights on the basis of roles and responsibilities governed by them.
The table shown below displays different pSuite users and their roles:
|
User Type |
Default Modules |
Function |
|
Administrators |
System, Master, Task Scheduling, Timesheet, Weekly Reporting, Reports and Utilities |
Users who are responsible for administering the system resources, maintenance and technical support for the feedback and queries reported relevant to the software’s functionality. |
|
Senior Management |
System, Master, Task Scheduling, Timesheet, Weekly Reporting, Reports and Utilities |
The topmost level for users who have complete access to all modules of pSuite. |
|
Accounts Managers |
Master, Task Scheduling, Timesheet, Weekly Reporting, Reports and Utilities |
Accounts managers are users who can create, modify or even delete the client and project related information. These users have access to the almost all modules of the system including Reports. |
|
Project Managers |
Master(partial access), Task Scheduling, Timesheet, Weekly Reporting, Reports and Utilities |
Project managers are the users mainly responsible for resource allocation and project maintenance. These are also responsible for defining project tasks, allocating them between its resources and review the timesheets filled by the resources. |
|
Quality Analysts |
Task Scheduling, Timesheet, Weekly Reporting, Reports and Utilities |
Quality analysts (QA) are those users of pSuite who control and view the information provided by different users of the software. |
|
General Users |
Timesheet and Utilities |
All users other than accounts managers and project managers are considered as general users of the system. General users have a limited roles and responsibilities inside the software, which can be enhanced or reduced by his/ her reporting manager. |
|
Guests |
Timesheet and Utilities |
Every new user created in pSuite is considered as a guest. A guest has a limited access to only two modules of the software i.e. Timesheet and Utilities. Initially no project is assigned to guests. After a project is assigned, he/ she is categorized as a general user of the software. |
|
Customers |
Master (project specific), Weekly Reporting (partial access) and Utilities |
Customers are the clients of RSI. Clients can view the details and current status of their projects that are under development and/ or completed so far. |
The pSuite software is web based application that can be only accessed by the active directory members of RSI. Anyone trying to access this software should have an active account in the active directory of RSI. Apart from being an active directory member he/ she should be a registered and active user of the pSuite as well. The pSuite software has an integrated authentication mechanism with database server and Windows server and software code in order to ensure the integrity and confidentiality of the software and its data.
|
|
How to log on to the pSuite for the first time? |

-
Open the web browser and access the URL of pSuite. A network authentication dialog box appears. Enter the active directory username prefixed with the domain name (e.g. IND-DEL/Username) and password in the User Name and Password fields respectively.
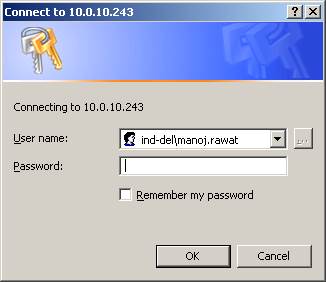
Figure 1: Network authentication dialog box
-
The pSuite authenticates the user name and the password in the active directory as the first level of authentication.
-
On successful authentication at the first level, it checks whether the user is available in the pSuite database or not. Being a new user to pSuite the Login page is displayed and a message “User Name not exists. Please Register...” appears. Now you need register your credentials in pSuite.
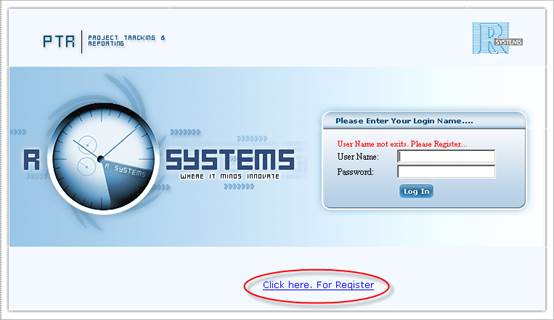
Figure 2: Login page with Register option
-
Click on the “Click here to register” link available at the lower side of the page. A New User page opens. Provide your credentials click on the Save button to create a new user account in the software and login to the Home page.
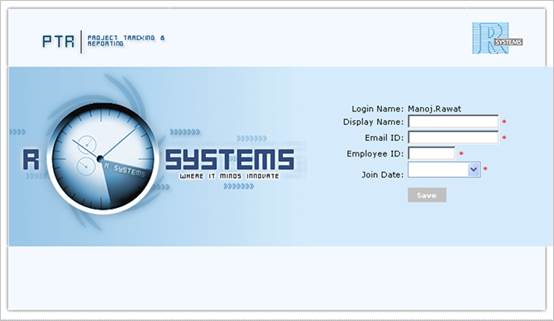
Figure 3: Registration page
|
|
What happen if the authentication fails at the first level? |
The user can try for three consecutive login attempts and afterwards, if authentication still fails, the error page HTTP 401.1 - Unauthorized: Logon Failed is displayed. First check for your user name, password and whether your user name is active or not then access the URL again.
|
|
What are the user rights and roles for the first time users? |
Once the first login attempt succeeds, the user is listed in the pSuite database. So, next time the user’s Home page is displayed directly after successful login. The newly created user is assigned the user rights and roles of a Guest in the system.
|
|
How to re-login to pSuite after logout? |
-
After a successful login, users may log out their currently active session by clicking the Logout button from the sub-header and the Login page is displayed.
-
Enter the active directory username prefixed with the domain name (e.g. IND-DEL\Username) and password in the User Name and Password fields respectively.
-
On successful authentication, the Home page of the application is displayed. Otherwise, a message “Invalid User Name/ Password” appears.
|
|
I get a message “Your session has expired. Please re-login” what to do now? |
-
After the specified session period the users are automatically logged out of the software and a message “Your session has expired. Please re-login” appears while accessing executing a particular action in the system. The Login page is displayed.
-
Enter the active directory username prefixed with the domain name (e.g. IND-DEL\Username) and password in the User Name and Password fields respectively.
-
On successful authentication, the Home page of the application is displayed. Otherwise, a message “Invalid User Name/ Password” appears.
After successful logon, the pSuite’s start page is displayed. This section explains the details, look and feel and functionality of the software’s UI. The components available in the UI are categorized into different categories:
-
Home Page
-
Top menu bar
-
User's Dashboard
-
Breadcrumb navigation
-
Data Grid
The Home page is the start page of the application. This page display different components of UI on the basis of roles assigned to the user and the customization opted by him/ her.
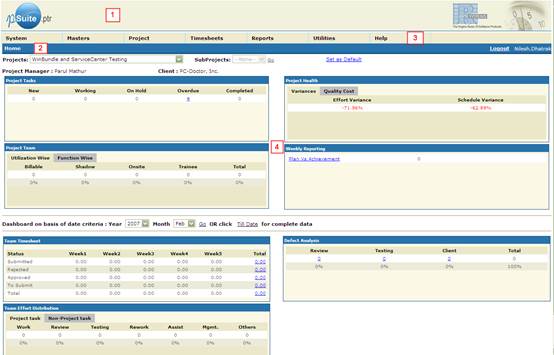
Figure 4: pSuite’s Home Page
The Home page contains following components:
-
Header – A pSuite logo and an RSI logo are available at the upper-left corner of the web page.
-
Sub-header – A sub-header is also available (below the Header). Following information is displayed in the sub-header:
-
Breadcrumb navigation.
-
User name.
-
Logout link
-
-
Top menu bar - A menu bar is available below the pSuite logo. It contains list of features and functionalities available for the logged in user.
-
User’s dashboard – A customizable dashboard is displayed at the middle of the web page. It displays the summary reports of various project related tasks and other details in the form of small web parts windows.
-
Data Grid – while performing a particular action, the relevant information is displayed in the User’s dashboard area in a data grid.
Top menu bar
The features and functionality of the software are categorized into different menus and consolidated as a single menu bar termed as Top menu bar. The menus for this menu bar appear on the basis of user’s rights and vary from one project to another project on the basis of roles assigned to him/ her in the selected project.
|
|
What are the features of menu bar? |
Following are the features of the Top menu bar available in pSuite:
-
Scrolling effect – Scrolling effect is very much important when the actual height of the web page increases beyond a minimum visibility limit set for the menu bar. This allows the user to view all available menus though the web page has been scrolled down.
-
Highlighted active menu –On the top menu bar when the mouse pointer is hovered the selected menu is highlighted with a dark shade at the background.
Each user who login to the system, gets a customizable dashboard which can be personalized according the user’s requirement. The components of the dash board are termed as web part windows. The number and type of web part windows varies according to the roles assigned to the user on individual projects.
|
|
How many types of zones are available in the dashboard? |
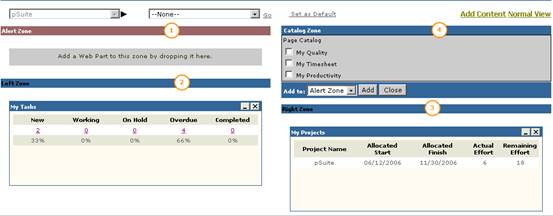
Figure 5: User’s Dashboard
The dashboard is divided into four major zones as follows:
-
Alert Zone - The upper-left area of the dashboard is labeled as the Alert Zone. Users can move those web parts in this area which are of very high priority for him/ her. All web part windows that are displayed in this area have a different window color.
-
Left Zone - The left side of the dashboard is labeled as the left zone of the page.
-
Right Zone - The left side of the dashboard is labeled as the left zone of the page.
-
Catalog Zone – The upper-right corner of the dashboard (above Right Zone) is labeled as the Catalog Zone. All web part windows that are yet to be placed in the dashboard are displayed here. Users can choose and add the web parts to any of the specified zones.
|
|
How to personalize the dashboard? |
-
Click on the Personalize button available at the upper-left corner of the dashboard. All web part windows gets converted to movable windows and the dashboard is divided into two zones i.e. Left Zone and Right Zone.
-
Click on the title bar of web part windows, drag and drop the selected web part to the desired sequence or place in the dashboard. As soon as the web part is dropped and its location changes, the information is saved into user’s credentials set for the dashboard.
-
Now click on the Normal View button to view dashboard in normal mode. Now the web parts cannot be relocated from one location to other.
|
|
How to remove unwanted web part windows? |
Clicking the  button in available in the title bar of the web part windows removes the specified window from the dashboard. In order to restore the removed window, user should add the deleted window.
|
|
How to hide infrequently used web part windows? |
Clicking the  button in available in the title bar of the web part windows hides the window contents from the dashboard and only the window title is displayed. In order to restore the minimized window, click on the
  button.
|
|
How to add a web part window? |
In order to add a new web part window, the user should be in the “Personalized” view. Following are the instructions for adding a new web part window:
-
Click on the Personalize button available at the upper-left corner of the dashboard to make the dashboard contents customizable.
-
Click on the Add Content button to add new contents to the dashboard. The list of available web parts is displayed in the Catalog Zone of the page. Select the web parts that are required to be placed in the dashboard. Choose the zone location where the selected web part should be placed and click on the Add button to add the selected web parts into the specified zone.
-
Now click on the Normal View button to view dashboard in normal mode.
|
|
What are the different web parts available in a general user’s dashboard? |
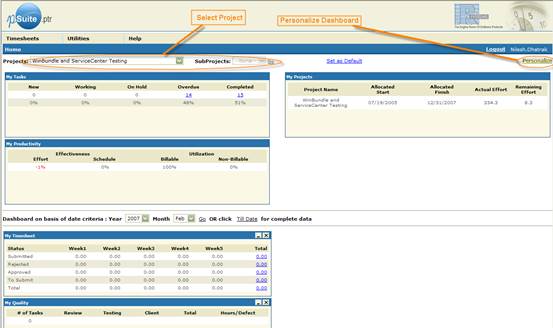
Figure 6: User’s Dashboard
The general user’s dashboard contains following web parts:
|
Web part |
Description |
|
My Tasks |
The My Tasks window display the summary all tasks that have been allocated to the current user. This window display following information: 1. New – Number of new tasks assigned and Actual Effort is Zero. 2. Working – Tasks on which the user is currently working upon. 3. On Hold – Tasks that have status as On-hold. 4. Overdue – Tasks that are not completed yet and the end date has passed. 5. Completed – Tasks that have been completed. Clicking the task count display the task details in a popup window. |
|
My Projects |
The My Projects window display the list of projects allocated to the developer, their start date, end date, actual effort and remaining efforts. |
|
My Quality |
The My Quality window provides the details of actual efforts required during the defect review. Following information is displayed in this window: 1. # of Tasks – The number of tasks allocated for review. 2. Review – Number of tasks categorized as Review. 3. Testing - Number of tasks categorized as Testing. 4. Client - Number of tasks categorized as Client’s feedback. 5. Total – Total number of tasks. 6. Actual – Actual effort (in hrs) required to complete the tasks. 7. Hours/ Defect – Average number of hours required per defect. |
|
My Productivity |
The My Productivity window displays the effectiveness v/s utilization for the tasks assigned. The effectiveness is calculated through Effort Variance and Schedule Variance of the project. |
|
My Timesheet |
The My Timesheet window displays the weekly timesheet of the selected user for the current month. Clicking on the values in the column “Total” displays the task-wise details into Billable and Non-Billable heads. |
|
|
What are different web parts available in the project manager’s dashboard? |
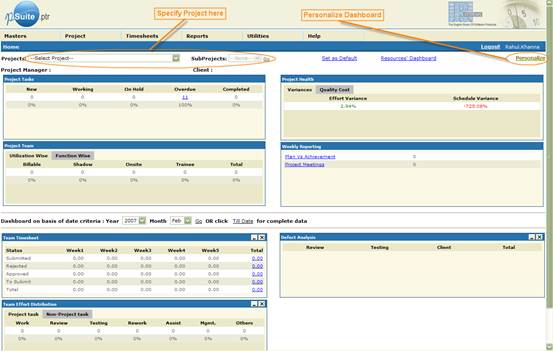
Figure 7: Project Manager’s Dashboard
The project manager’s dashboard contains following web parts:
|
Web part |
Description |
|
Team Tasks |
The Team Tasks window display the summary all tasks that have been allocated to all resources. This window display following information: 1. New – Number of new tasks assigned and Actual Effort is Zero. 2. Working – Tasks on which the user is currently working upon. 3. On Hold – Tasks that have status as On-hold. 4. Overdue – Tasks that are not completed yet and the end date has passed. 5. Completed – Tasks that have been completed. Clicking the task count display the task details in a popup window. |
|
Weekly Reports |
The Weekly Reports window displays the list of different project related reports that can be viewed with the software. Clicking the links opens the relevant report in a popup window. |
|
Quality Analysis |
The Quality Analysis window displays the quality analysis report for the specified project. The number of defects reported in the project is displayed in the Defect Count tab and the Quality Cost tab displays the actual quality analysis. |
|
Team Effort Distribution |
This window displays the number ratio of hours utilized by the resources in project and non-project tasks for the selected project in two different tabs. |
|
Project Team |
The Project Team window displays the team details for the selected project on the basis of two criteria i.e. utilization wise and function wise in two different tabs. |
|
Project Health |
The Project Health window displays the current project’s status in terms of Budget Variance and Schedule Variance. |
|
Team Timesheet |
The Team Timesheet window displays the weekly timesheets of all resources for the current month. Clicking on the values in the column “Total” displays the resource-wise details into Billable and Non-Billable heads. |
|
Comments |
This window displays different comments and feedbacks given by the authorized resources of the project. |
|
|
What are different web parts available for the accounts managers and senior management? |
The accounts managers and senior management have the dashboard common to that of the project manager. In addition, a button named “Pie-Chart” is available which show different project and client related pie-chart reports.
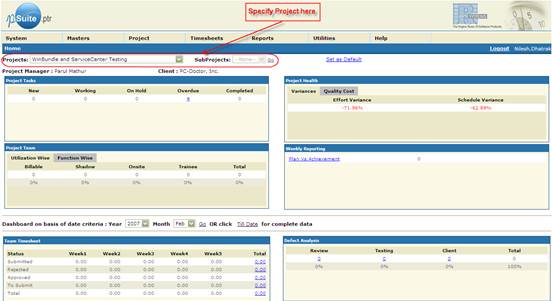
Figure 8: Dashboard for senior management
Breadcrumbs or breadcrumb trails is a navigation technique used in user interfaces. Its purpose is to give users a way to keep track of their location within programs or documents. This type of navigation typically appears horizontally across the top of a webpage, usually below any title bars or headers. They provide links back to each previous page that the user navigated through in order to get to the current page. Breadcrumbs provide a trail for the user to follow back to the starting/entry point of a website. They may look something like this:
Home page -> Section page -> Sub section page
|
|
What are the different types of breadcrumbs? |
There are three types of web breadcrumbs:
-
Path - Path breadcrumbs are dynamic and show the path that the user has taken to arrive at a page.
-
Location - Location breadcrumbs are static and show where the page is located in the website hierarchy.
-
Attribute - Attribute breadcrumbs give information that categorizes the current page.
|
|
What is a read-only breadcrumb? |
A breadcrumb is read-only when the user is at the same page.
|
|
What is a hyperlinked breadcrumb? |
Generally, the breadcrumbs are hyperlinks to the parent page or process. An underline is displayed below each hyperlinked breadcrumb. Clicking the breadcrumb displays the relevant page or process. While navigating between breadcrumbs, any information written in the child page is lost.
|
|
Where does the breadcrumb navigation displayed in pSuite? |
In the pSuite, breadcrumbs are available in the sub-header (available at the top of the User’s dashboard).
The information in the pSuite software is displayed in a grid layout or tabular format termed as Data Grid.
|
|
What are the features of data grid? |
The data grid has following features:
-
Labeled columns – Each column in the data grid contains a label specifying the type of information displayed.
-
Movable column headers – At some pages or instances the column header of the data grid can be re-positioned according to the user’s requirement of sequence dragging and dropping the column header within the grid.
-
Sorting on the basis of column headers – Data available in the grid can be sorted in ascending or descending order by either clicking or double clicking the column headers.
-
Resizable data grid – The data columns of the data grid are resizable i.e. these can be expanded or reduced in their horizontal lengths.
-
Editable grid contents – At some pages or instances, an editable data grid is available. Such grids allow users to change the values displayed in the grid by either double clicking the cell or selecting the cell and pressing F2 key.
-
Labeled Grid Header – At some places or instances, the data grid has a labeled header. The grid header allows users to show or hide the data grid.
|
|
How to show/ hide the data grid having a labeled grid header? |
-
Double click on the grid header to show or hide the labeled data grid.
-
Clicking the
 /
/  (toggle) button also show/ hide the labeled data grid.
The pSuite software comprises of five modules and three reports. Each module and report is further sub-divided into sub-modules having certain features.
|
|
What are the different types of modules in pSuite? |
The list of modules and sub-modules available in pSuite are shown in the table below:
|
Module Name |
Sub modules |
User rights |
|
Home |
Dashboard |
View the user’s dashboard of accounts manager. |
|
|
QA-Dashboard |
View the user’s dashboard of QA. |
|
System |
Access Rights |
Assign/ remove access rights to various department roles. |
|
|
Configuration |
View/ modify the software settings. |
|
|
Departments |
Create, modify, view and remove departments. |
|
|
Non-project tasks |
Create, modify, view and remove non-project tasks. |
|
|
Project type |
Create, modify, view and remove project types. |
|
|
Roles |
Create, modify, view and remove department roles. |
|
|
Resources |
Create, modify, view and remove project resources. |
|
|
Workflow |
Create, modify, view and remove project workflow. |
|
Masters |
Client View/ Edit |
Create, modify, view and remove client details. |
|
|
Project View/ Edit |
Create, modify, view and remove projects. |
|
|
Resource Pool |
Manage resource pool for the projects. |
|
|
Documents |
Add, modify, view and remove project and client related documents. |
|
|
Task Templates |
Create, modify, view and remove task templates. |
|
Scheduling |
Task Scheduling |
Create, modify, view and remove tasks. |
|
|
Task Scheduling Report |
View project wise task scheduling report. |
|
Timesheet |
Timesheet Entry/ View |
View and fill timesheet. |
|
|
Timesheet Review |
Review timesheets filled by the resources. |
|
|
What are the different types of reports in pSuite? |
The list of reports and sub-reports available in pSuite are shown in the table below:
|
Report Name |
Sub report |
Description |
|
Weekly reports |
Plans v/s Achievements |
The summary report on plans v/s achievement per project. |
|
|
Project Requests |
The summary report of number of resources required per project. |
|
|
Event Impacting Scheduling |
The summary report on various events that affects the project schedule. |
|
|
Defect Analysis |
The summary report on defect analysis per project. |
|
|
Deliveries |
The summary report on project deliveries. |
|
|
Voice of Customer |
The summary report of the customer’s feedback per project. |
|
Timesheet Reports |
Timesheet Reporting |
The project wise summary report on timesheets filled by the resources. |
|
|
Project track-wise |
The project tracking report for the resources. |
|
|
Project Resource-wise |
The summary report of the resources utilization in a project. |
|
|
Resource Project-wise |
The project wise summary report of the tasks for individual project resources. |
|
|
Project Monthly Invoice |
The summary report of the monthly invoice per project. |
|
|
Project Charge-wise |
The summary report for the project invoices. |
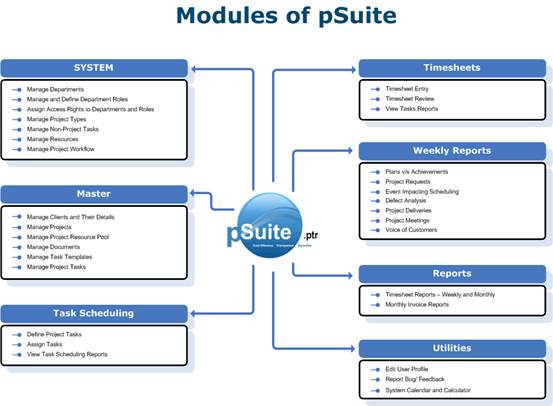
The graphical representation shown below describes the summary of functions available in different modules and reports of pSuite:
This section provides an overview of the pSuite features that are available for different type of users of pSuite.
|
|
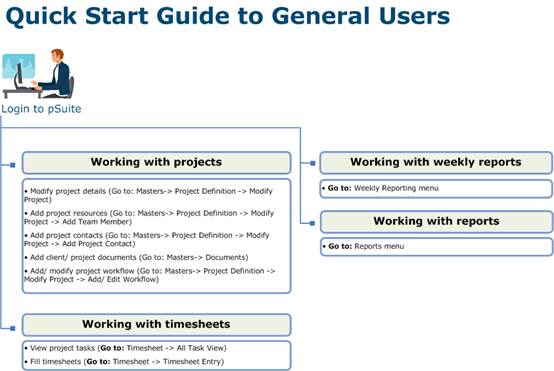
What are the pSuite features available for general users? |
The graphics shown below provides an overview of the features available for the general users:
|
|
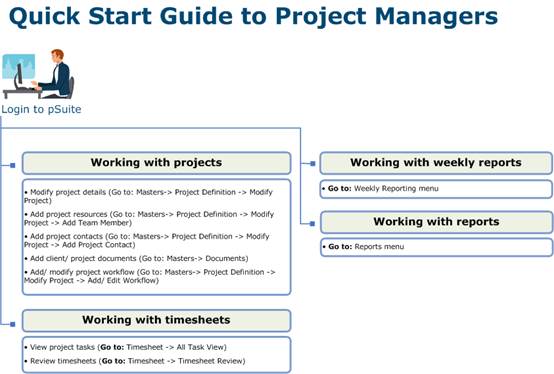
What are the pSuite features available for project managers? |
The project managers are allowed to work upon allocated projects only. The graphics shown below provides an overview of the features available for the project managers:
|
|
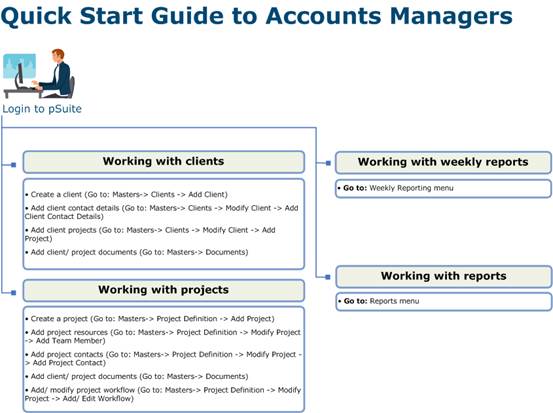
What are the pSuite features available for accounts managers? |
The accounts managers have access to all features available to project managers and general users. The access rights are specific to the assigned projects only. The graphics shown below lists out additional features for the accounts managers:
|
|
What are the pSuite features available for senior management? |
Unlike project managers and accounts managers, the senior managers have access to all features of pSuite for all projects currently running at RSI.
|
|
What are the pSuite features available for administrators? |
The administrators have full control on the pSuite software. This includes the rights for Sr. management in addition to the rights on system resources.